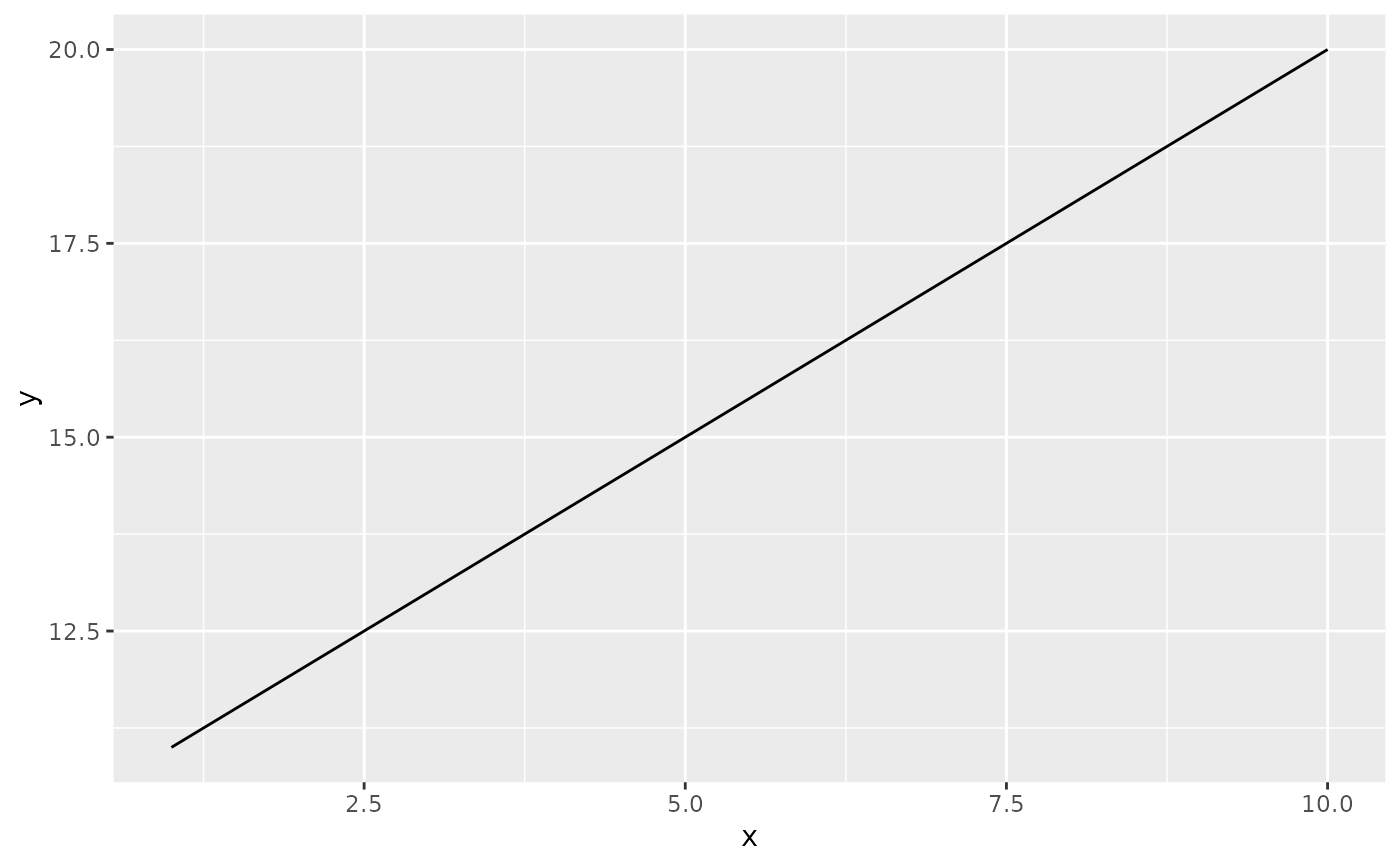
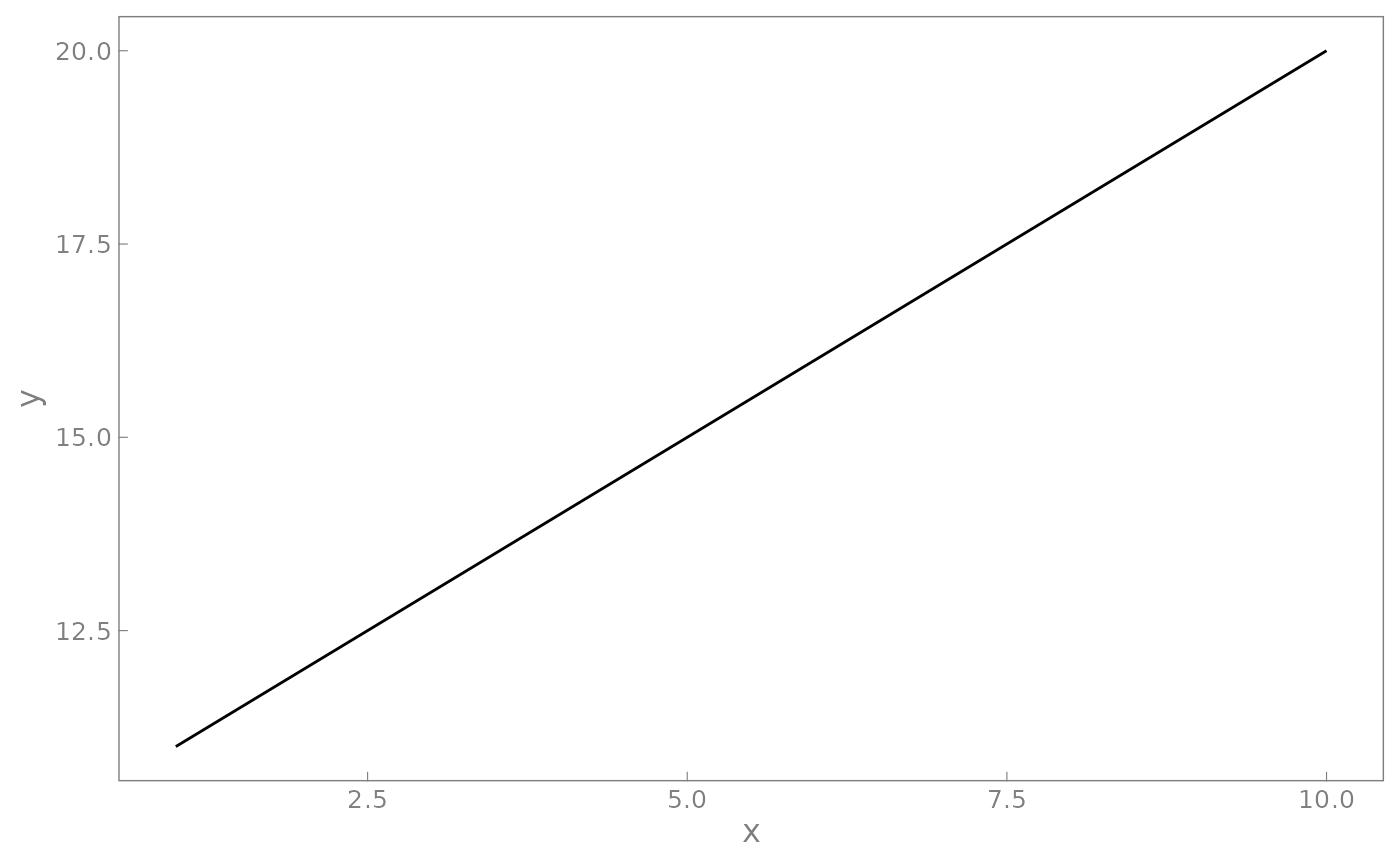
Set a pleasing theme for graphs.
xy_theme.RdProvides a pleasing graphical style for ggplot2 that includes
gray axes,
gray tic marks,
inward-pointing tic marks,
right-justified y-axis labels,
no grid lines, and
white background.
Usage
xy_theme(
  font_size = 12,
  font_family = "",
  font_size_scale = 0.8,
  spacing_scale = 0.2,
  x_axis_labels_spacing = spacing_scale * font_size,
  y_axis_labels_spacing = spacing_scale * font_size,
  col_facet_labels_spacing = spacing_scale * font_size,
  row_facet_labels_spacing = spacing_scale * font_size,
  tick_length = -1.5 * spacing_scale * font_size,
  border_and_label_colour = "gray50"
)
Arguments
- font_size
The base font size in points for fonts and other graphical elements.
font_sizeis directly the size of the x- and y-axis titles. Default is12.- font_family
The font family used in the graph. Default is an empty string (
""), a sans-serif font.- font_size_scale
A default scale factor for non-axis-title fonts. Default is
0.8. Change this parameter if you want to change the size of all non-axis-title text.- spacing_scale
A default scale factor for spacing between text and axes. Default is
0.2.- x_axis_labels_spacing
The distance between x axis labels and the x axis itself in points. Default is
spacing_scale*font_size, normally 2.4 points.- y_axis_labels_spacing
The distance between y axis labels and the y axis itself in points. Default is
spacing_scale*font_size, normally 2.4 points.- col_facet_labels_spacing
The distance between x strip text (labels at the top of a faceted plot) and the top border of the individual graphs in points. Default is
spacing_scale*font_size, normally 2.4 points, to leave space for descenders.- row_facet_labels_spacing
The distance between y strip text (labels to the right of a faceted plot) and the right border of the individual graphs in points. Default is
spacing_scale*font_size, normally 2.4 points, to leave space for descenders.- tick_length
The tick length in points. Default is
-1.5*spacing_scale*font_size, normally -3.6 points, so the ticks will be slightly longer than the spacing between text and borders. Negative tick length indicates the ticks should be placed inside the graph, where ticks belong!- border_and_label_colour
The colour for borders and labels. Default is "gray50".
Details
By default, the font size for axis titles is set by font_size.
The font size for all other text elements is scaled relative to font_size,
by default 80% smaller than the axis titles.
Adjust font_size_scale if 80% is not to your liking.
Spacing between graphical elements can be specified with more precision
using this function.
spacing_scale adjusts spacing relative to font_size for all
graphical elements.
But spacing between axis labels and strip labels and nearby
graph borders can also be specified individually.
See the vignette for examples.