A function to make sensitivity graphs for rebound analysis.
Usage
sensitivity_graphs(
  .parametric_data = parametric_analysis(rebound_data, parameterization),
  rebound_data = NULL,
  parameterization = NULL,
  x_var,
  y_var,
  line_var = y_names_col,
  y_names_col = ReboundTools::graph_df_colnames$y_names_col,
  y_vals_col = ReboundTools::graph_df_colnames$y_vals_col,
  graph_params = ReboundTools::sens_graph_params,
  point_type_colname = ReboundTools::parametric_analysis_point_types$point_type_colname,
  sweep_points = ReboundTools::parametric_analysis_point_types$sweep,
  orig_points = ReboundTools::parametric_analysis_point_types$orig
)
Arguments
- .parametric_data
A data frame, likely the result of calling
parametric_analysis(). Default isparametric_analysis(rebound_data, parameterization).- rebound_data
Rebound data, likely read by
load_eeu_data(). Default isNULL.- parameterization
A list of lists that gives parameter sweeps. At the top level, the list items must be named for cases in
rebound_data. At the next level, the parameters to be swept should be given, along with their sweep values. See examples. Default isNULL.- x_var, y_var
Strings that identify the x-axis and y-axis variables for this sensitivity graph. These variables must appear in
.parametric_data.x_varmust be a single string.y_varcan be a vector of strings. See examples.- line_var
The name of variable to be used to discriminate lines on the graph. Default is
y_names_col.- y_names_col, y_vals_col
- graph_params
A list of parameters to control graph appearance. See
ReboundTools::sens_graph_params.- point_type_colname, sweep_points, orig_points
Details
The caller can adjust the aesthetics of the graph with manual scales.
The order of y_var will determine layering on the graph.
The first item in y_var will be the lowest layer.
The last item in y_var will be the highest layer.
Examples
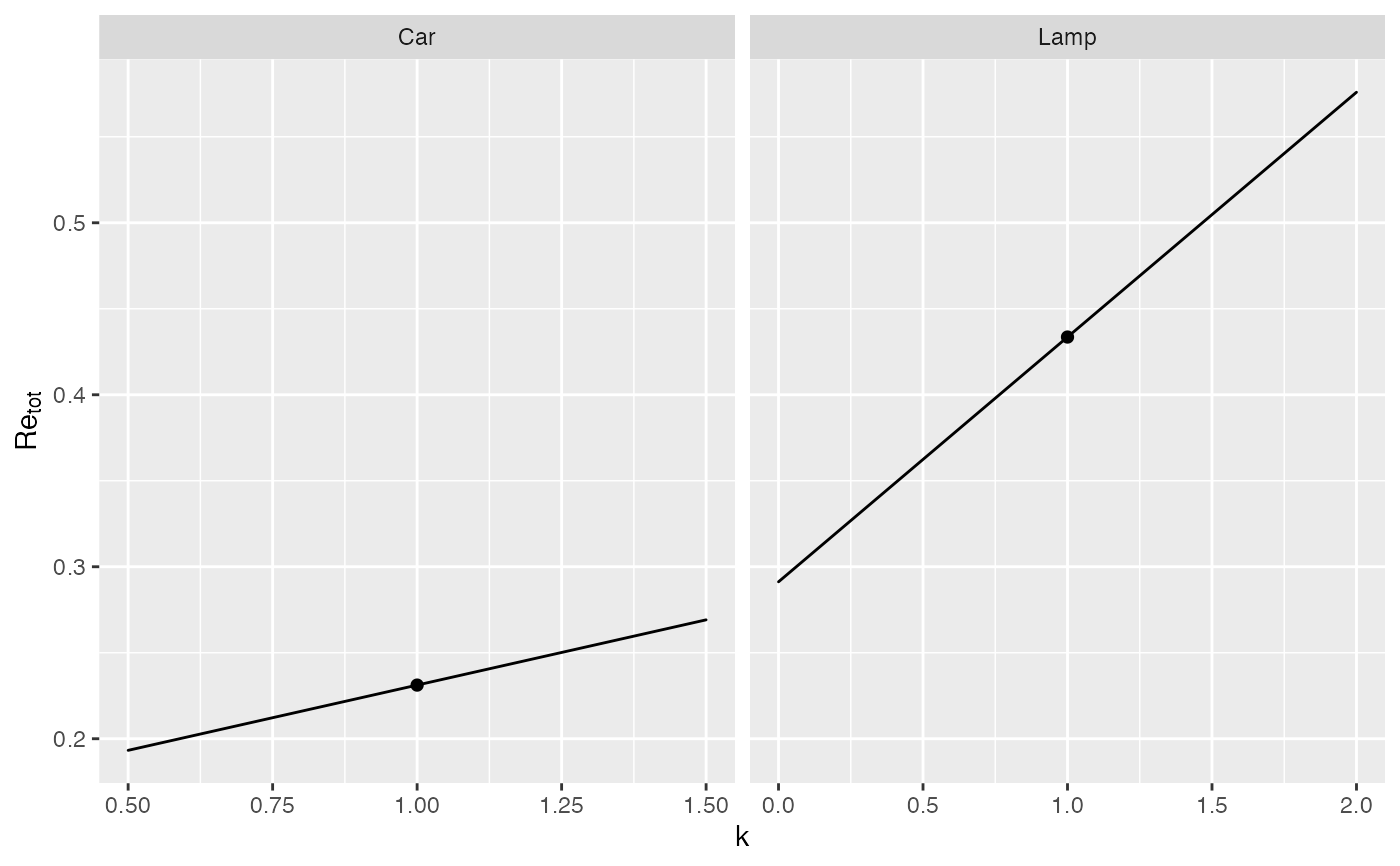
# Sensitivity of total rebound (Re_tot) to macro multiplier (k)
df <- load_eeu_data()
sens_params <- list(Car = list(k = seq(0.5, 1.5, by = 0.5)),
                    Lamp = list(k = seq(0, 2, by = 1)))
sensitivity_graphs(rebound_data = df, parameterization = sens_params,
                   x_var = "k", y_var = "Re_tot") +
 ggplot2::facet_wrap(facets = "Case", scales = "free_x") +
 ggplot2::scale_colour_manual(values = c(Re_tot = "black"), guide = "none") +
 ggplot2::scale_discrete_manual(aesthetic = "linewidth",
                                values = c(Re_tot = 0.5), guide = "none") +
 ggplot2::scale_linetype_manual(values = c(Re_tot = "solid"), guide = "none") +
 ggplot2::labs(y = expression(Re[tot]),
               colour = ggplot2::element_blank(),
               size = ggplot2::element_blank(),
               linetype = ggplot2::element_blank())


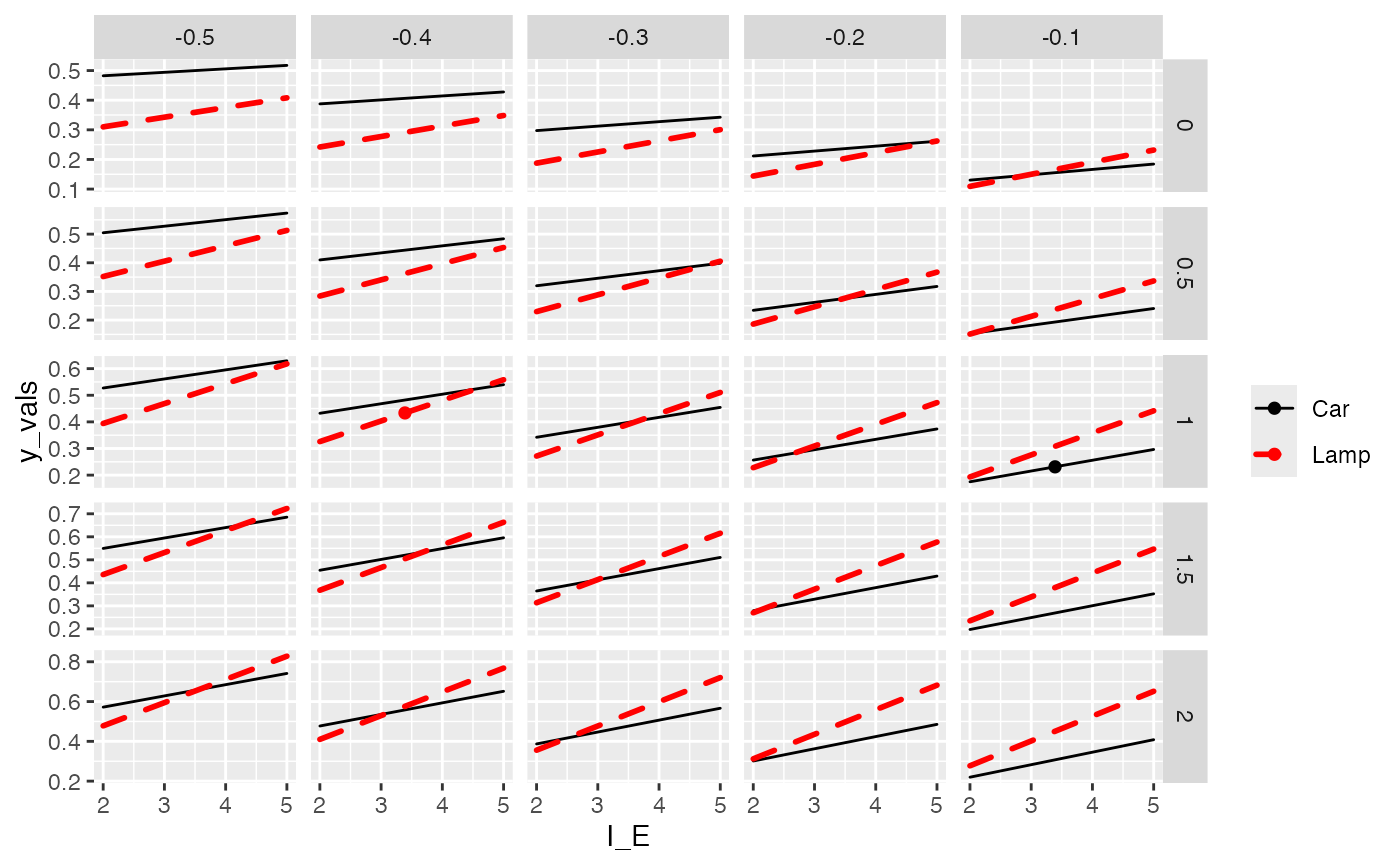
# A more complicated example that shows multi-variate sensitivity.
# Values of the macro parameter (k) are shown in rows of the lattice plot.
# Uncompensated price elasticity of energy service consumption (e_qs_ps_UC)
# is shown in columns of the lattice plot.
# Total rebound (Re_tot) is given on the y-axis, and
# energy intensity of the economy (I_E) is given on the x-axis.
# The cases (Car and Lamp) are shown as different lines.
sens_params_2 <- list(Car = list(k = seq(0, 2, by = 0.5),
                               I_E = seq(2, 5, by = 1),
                               e_qs_ps_UC_orig = seq(-0.5, -0.1, by = 0.1)),
                    Lamp = list(k = seq(0, 2, by = 0.5),
                                I_E = seq(2, 5, by = 1),
                                e_qs_ps_UC_orig = seq(-0.5, -0.1, by = 0.1)))
# Choose which rebound variables to include and their order.
sensitivity_graphs(rebound_data = df, parameterization = sens_params_2,
                   x_var = "I_E",
                   y_var = "Re_tot",
                   line_var = "Case") +
  ggplot2::facet_grid(rows = ggplot2::vars(k),
                      cols = ggplot2::vars(e_qs_ps_UC_orig), scales = "free_y") +
  ggplot2::scale_colour_manual(values = c(Car = "black", Lamp = "red")) +
  ggplot2::scale_discrete_manual(aesthetic = "linewidth",
                                 values = c(Car = 0.5, Lamp = 1.0)) +
  ggplot2::scale_linetype_manual(values = c(Car = "solid", Lamp = "dashed")) +
  ggplot2::labs(colour = ggplot2::element_blank(),
                linewidth = ggplot2::element_blank(),
                linetype = ggplot2::element_blank())


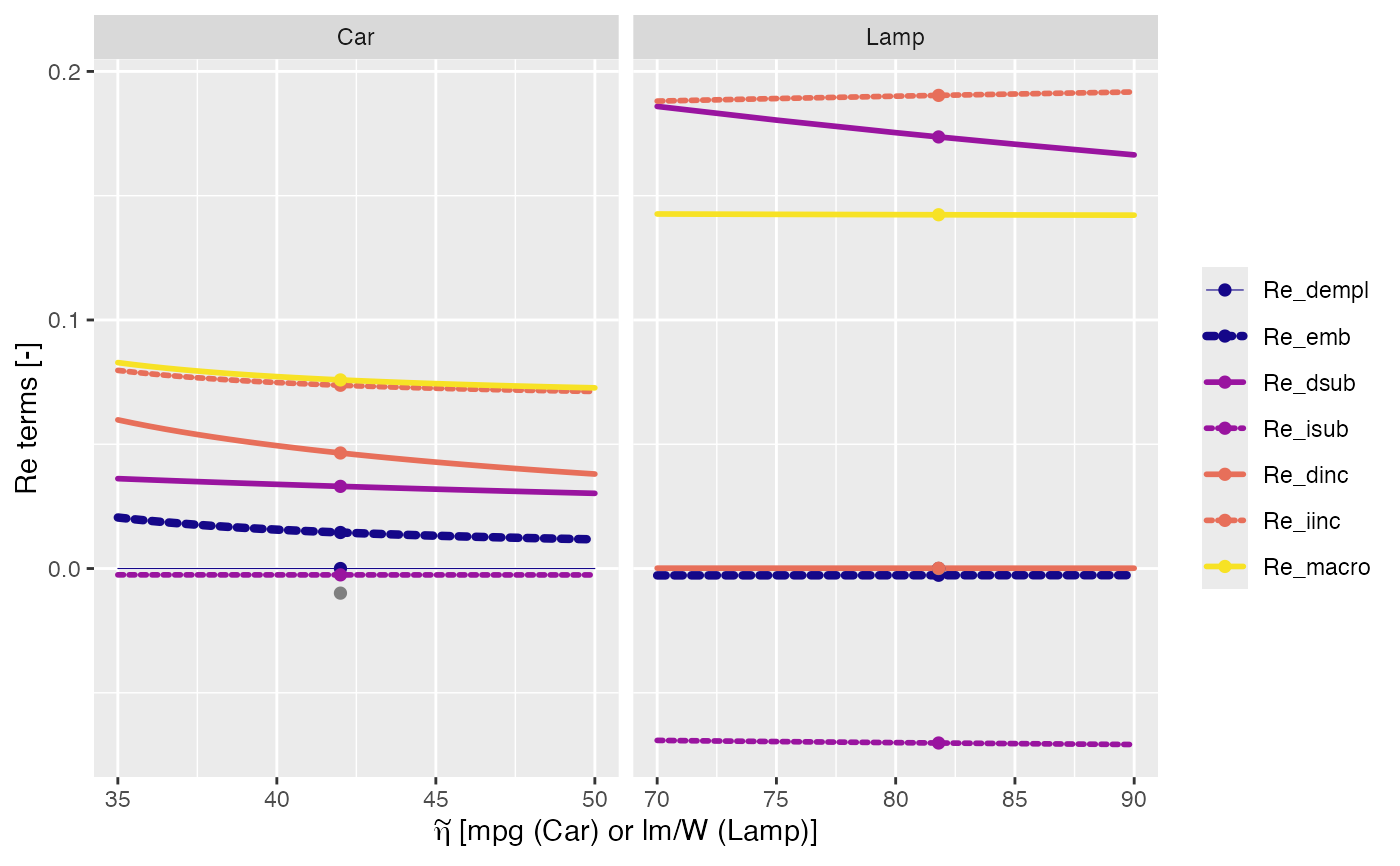
# Plot all rebound terms as a function of post-upgrade efficiency
sens_params_3 <- list(Car = list(eta_engr_units_star = seq(35, 50, by = 0.5)),
                      Lamp = list(eta_engr_units_star = seq(70, 90, by = 5)))
# Choose rebound terms to include in the graph and their order
rebound_vars <- c("Re_dempl", "Re_emb", "Re_omd", "Re_dsub", "Re_isub",
                  "Re_dinc", "Re_iinc", "Re_macro")

sensitivity_graphs(rebound_data = df,
                   parameterization = sens_params_3,
                   x_var = "eta_engr_units_tilde",
                   y_var = rebound_vars) +
  ggplot2::facet_wrap(facets = "Case", scales = "free_x") +
  ggplot2::scale_colour_manual(values =
        c(Re_dempl = ReboundTools::path_graph_params$dempl_colour,
          Re_emb = ReboundTools::path_graph_params$emb_colour,
          Re_md = ReboundTools::path_graph_params$md_colour,
          Re_dsub = ReboundTools::path_graph_params$dsub_colour,
          Re_isub = ReboundTools::path_graph_params$isub_colour,
          Re_dinc = ReboundTools::path_graph_params$dinc_colour,
          Re_iinc = ReboundTools::path_graph_params$iinc_colour,
          Re_macro = ReboundTools::path_graph_params$macro_colour),
                               breaks = rebound_vars) +
 ggplot2::scale_discrete_manual(
        aesthetic = "linewidth",
        values =
        c(Re_dempl = 0.2,
          Re_emb = ReboundTools::path_graph_params$emb_linewidth,
          Re_md = ReboundTools::path_graph_params$md_linewidth,
          Re_dsub = ReboundTools::path_graph_params$dsub_linewidth,
          Re_isub = ReboundTools::path_graph_params$isub_linewidth,
          Re_dinc = ReboundTools::path_graph_params$dinc_linewidth,
          Re_iinc = ReboundTools::path_graph_params$iinc_linewidth,
          Re_macro = ReboundTools::path_graph_params$macro_linewidth),
                            breaks = rebound_vars) +
ggplot2::scale_linetype_manual(values =
        c(Re_dempl = ReboundTools::path_graph_params$dempl_linetype,
          Re_emb = ReboundTools::path_graph_params$emb_linetype,
          Re_md = ReboundTools::path_graph_params$md_linetype,
          Re_dsub = ReboundTools::path_graph_params$dsub_linetype,
          Re_isub = "11",
          Re_dinc = ReboundTools::path_graph_params$dinc_linetype,
          Re_iinc = "11",
          Re_macro = ReboundTools::path_graph_params$macro_linetype),
                               breaks = rebound_vars) +
ggplot2::labs(x = expression(tilde(eta)*" [mpg (Car) or lm/W (Lamp)]"),
              y = "Re terms [-]",
              colour = ggplot2::element_blank(),
              linewidth = ggplot2::element_blank(),
              linetype = ggplot2::element_blank())
#> Warning: Removed 38 rows containing missing values or values outside the scale range
#> (`geom_path()`).
